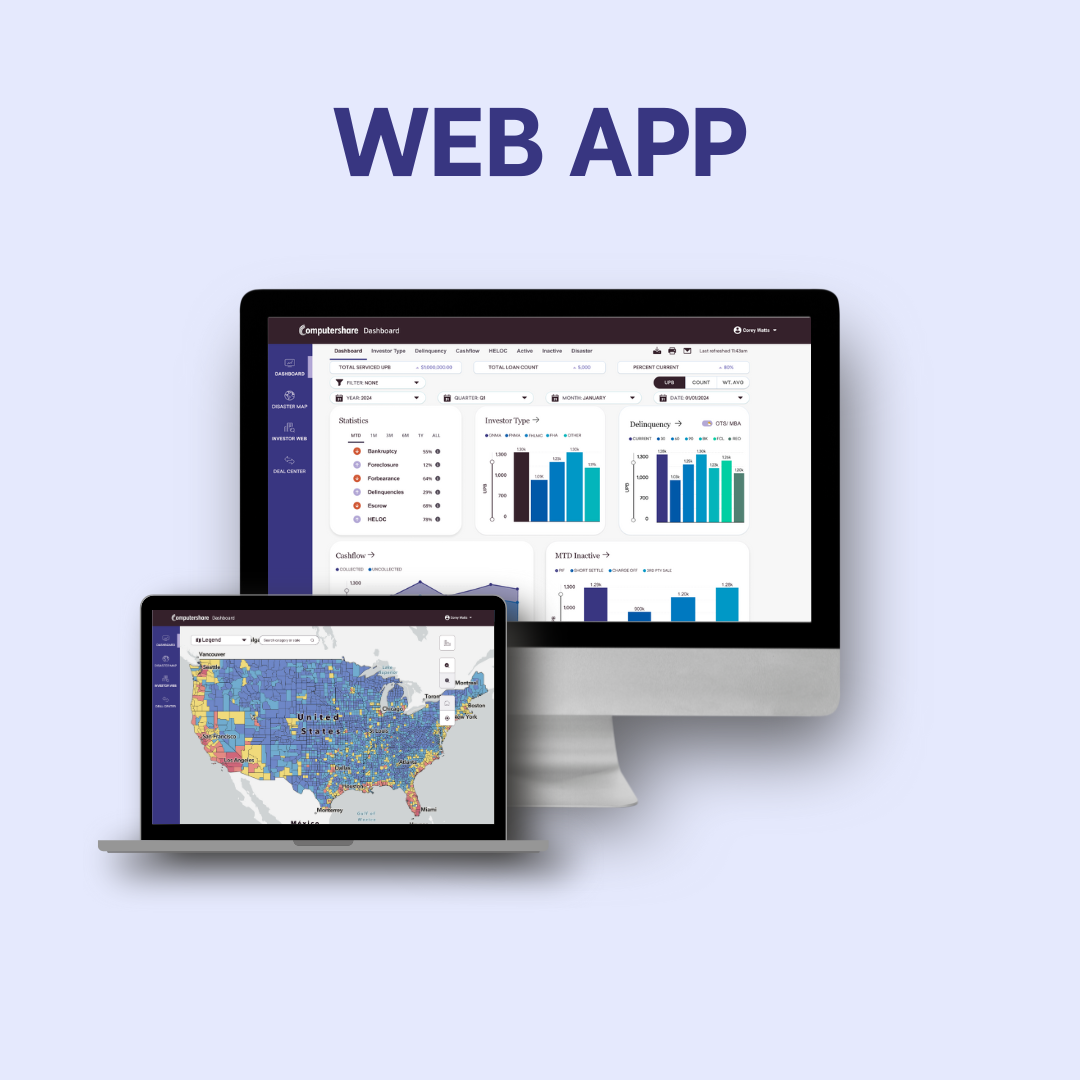
Project Insight Analytical Dashboards
This case study highlights the work done on an enterprise-grade analytics dashboard designed for over 100 investors, aimed at reducing data retrieval time by 30% and improving portfolio insights.
Despite receiving positive feedback from users, the project did not launch due to company restructuring following an acquisition.
📌 Introduction
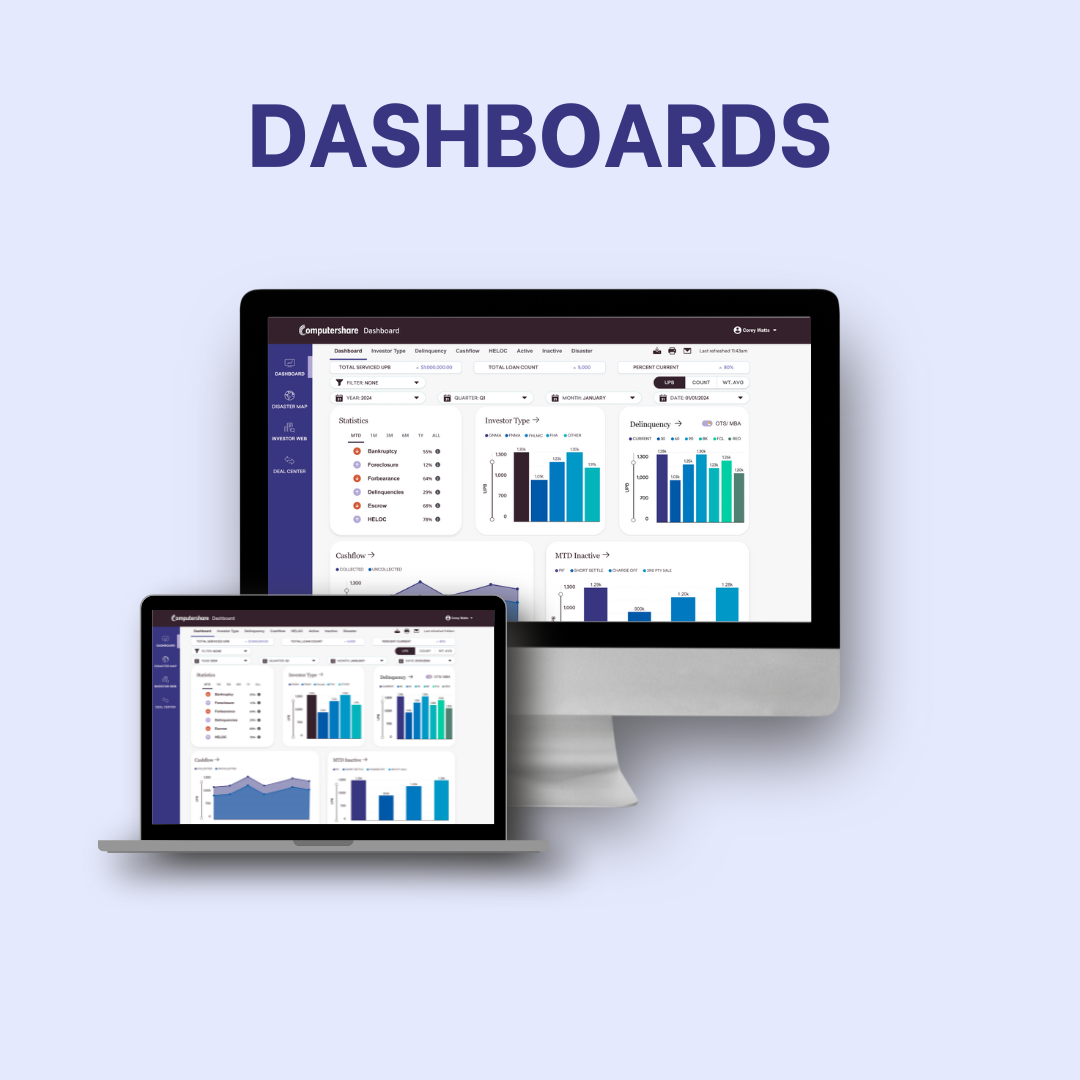
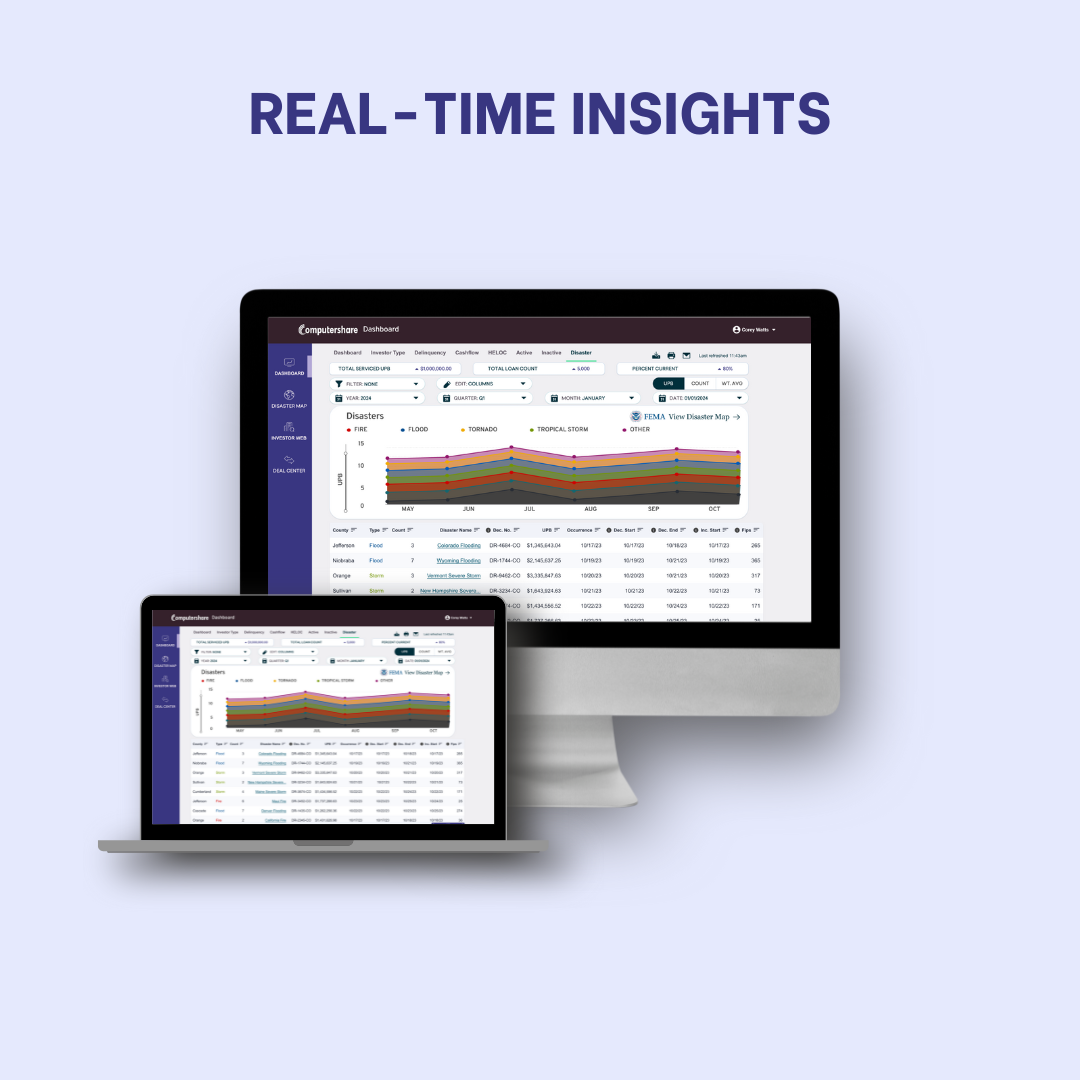
- Objective: Build a responsive analytics dashboard integrating data visualization, portfolio tracking, and predictive analytics for improved decision-making.
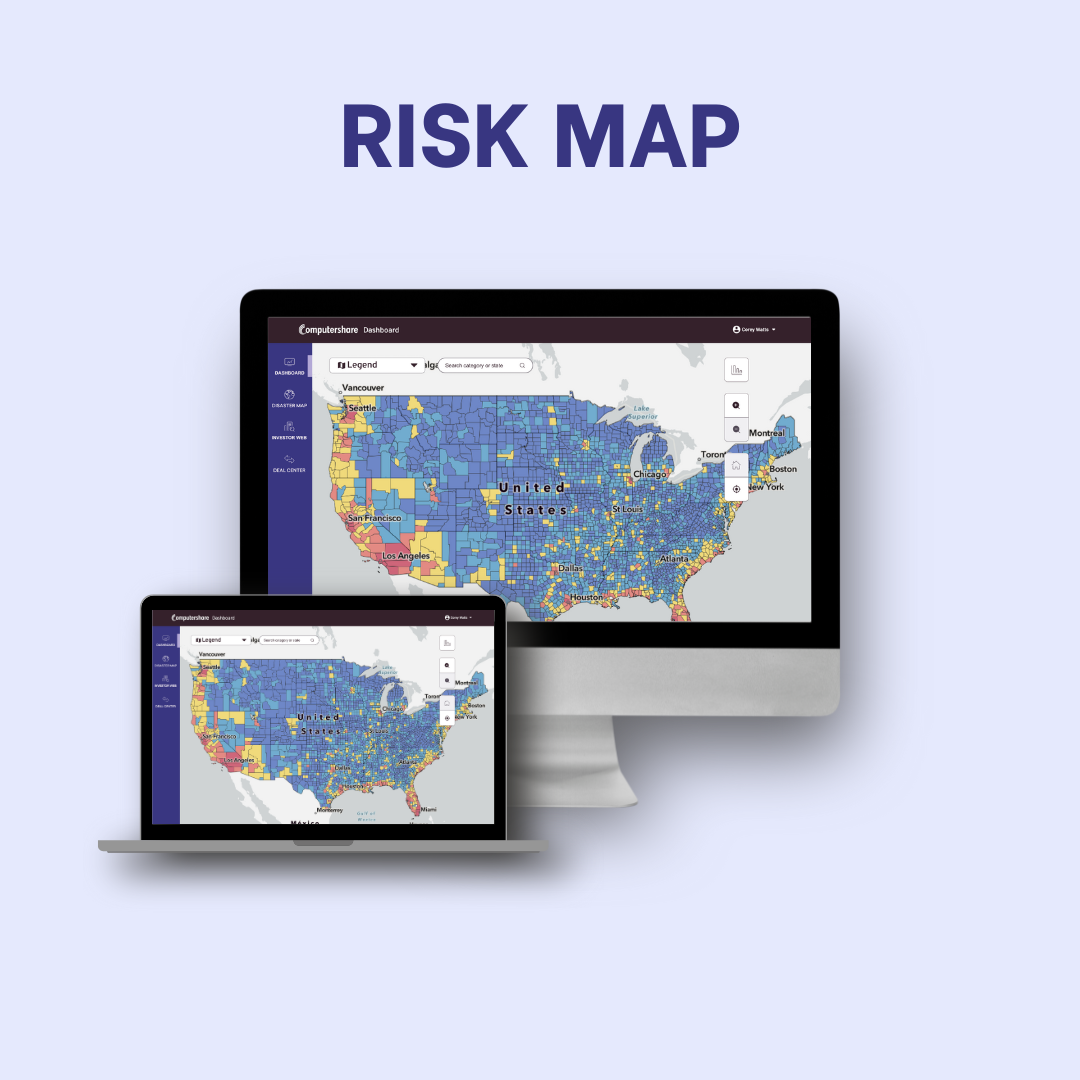
- Scope: Interactive Dashboards, Real-Time Portfolio Monitoring, Disaster Risk Mapping (FEMA integration), Accessibility & Cross-Device Support
- Key Focus Areas: Timely Data Access, Risk Assessment & Visualization, Live Portfolio Insights, UX/UI Accessibility, Team Collaboration
❌ The Challenge
- Slow Data Access: Delayed insights impacted investor decision-making.
- No Real-Time Risk View: Inability to assess natural disaster impacts on portfolios.
- Poor Performance Tracking: Manual processes slowed down strategy adjustments.
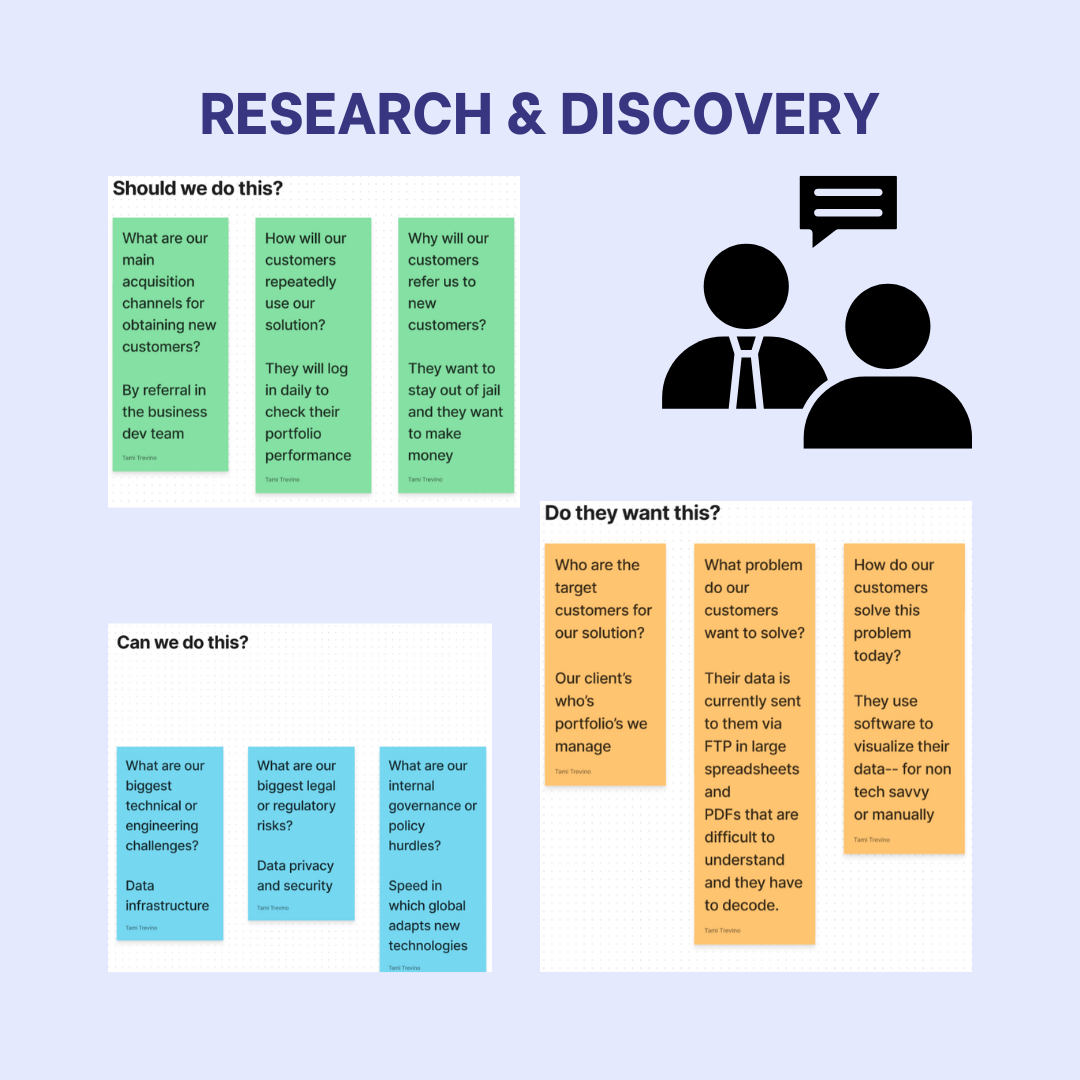
Strategic Approach


Optimized portfolio tracking for immediate insights, reducing reliance on manual processes and enhancing overall investment strategy execution.
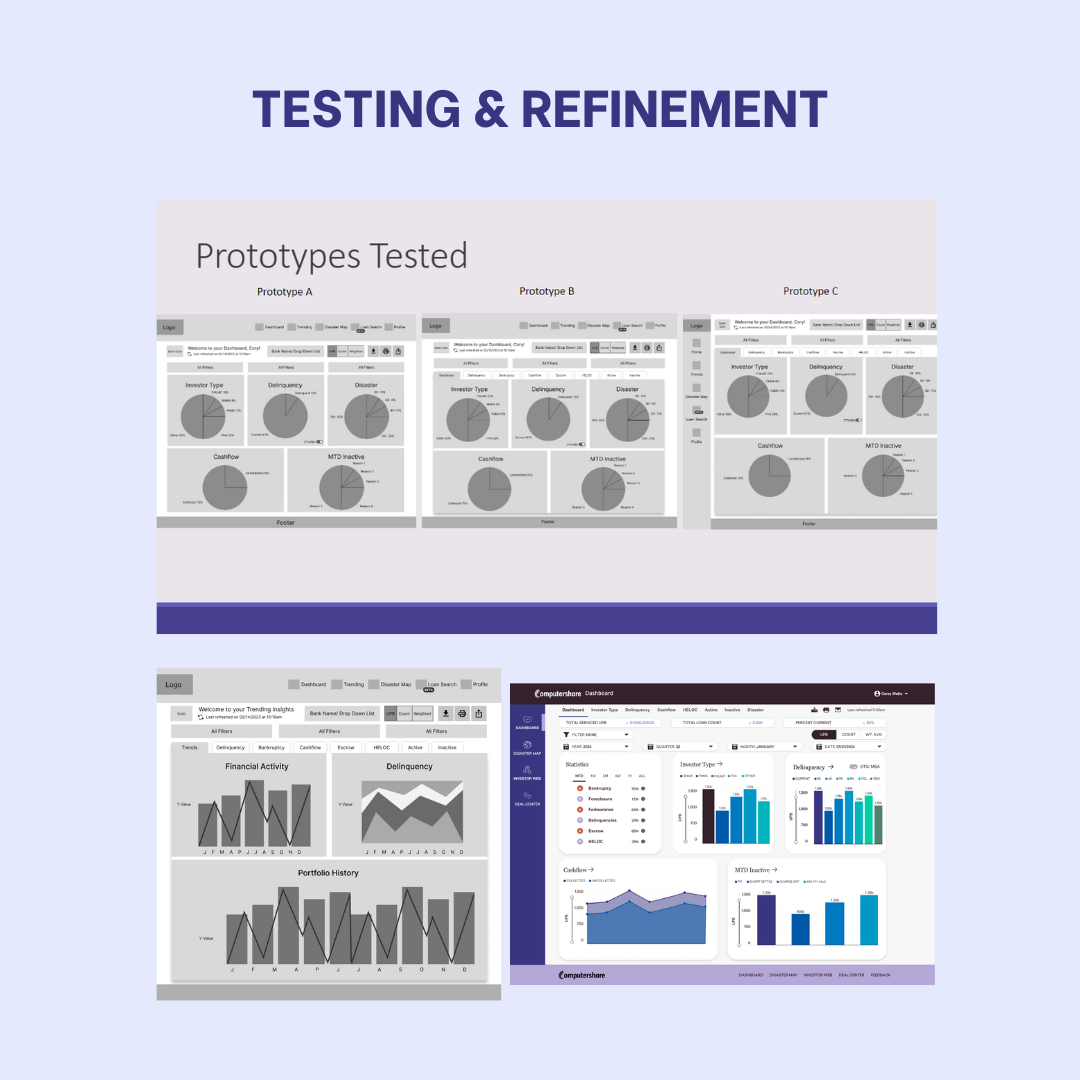
Design Process
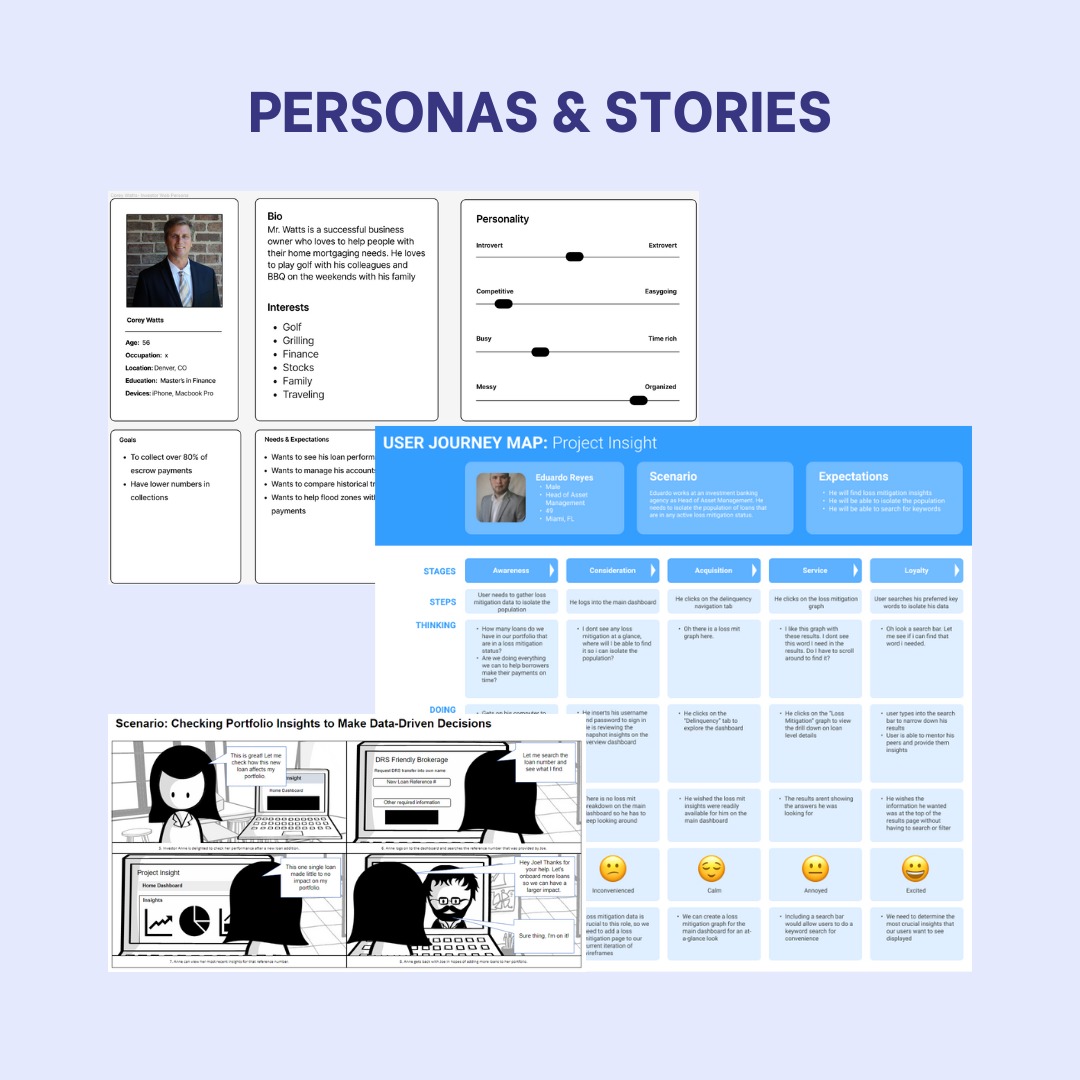
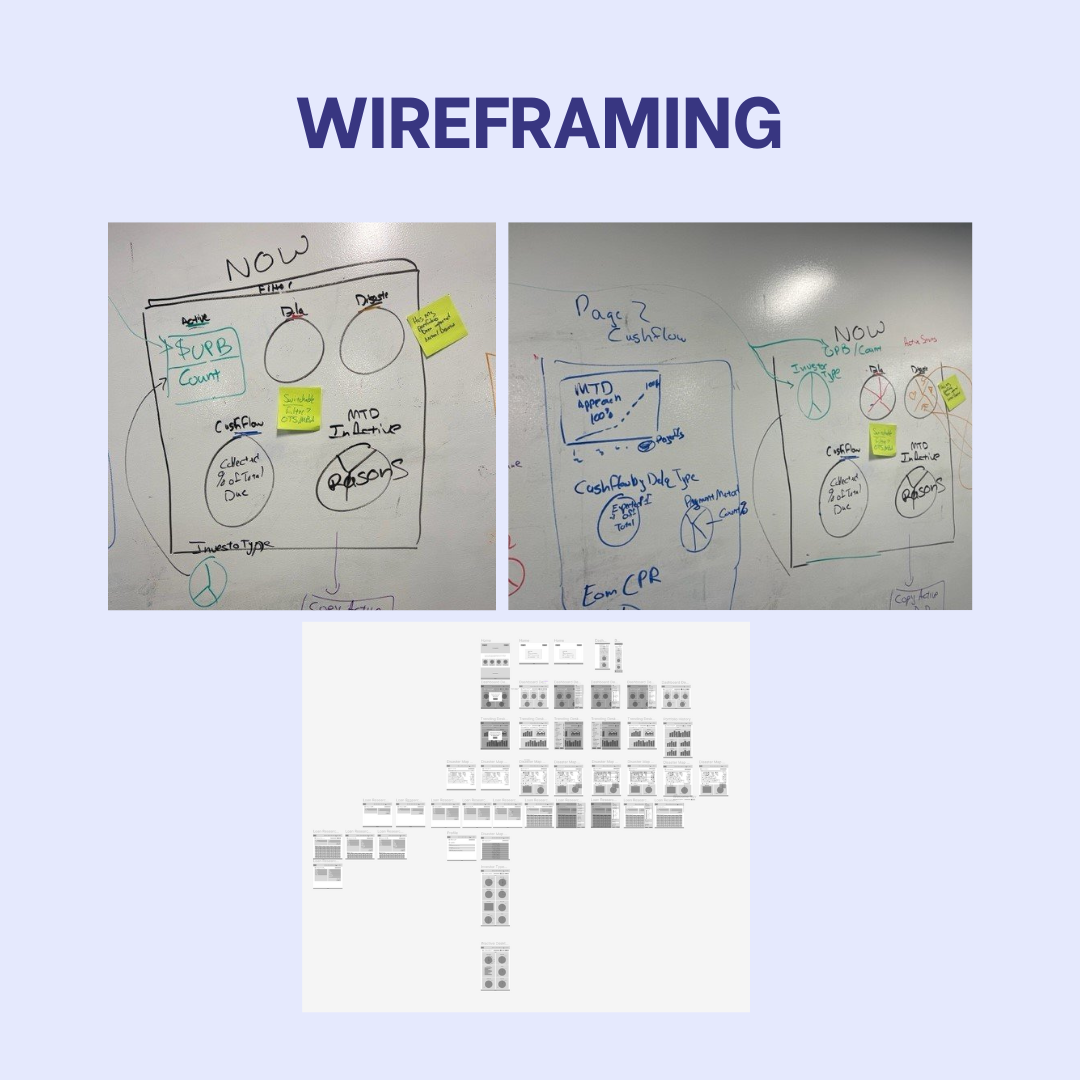

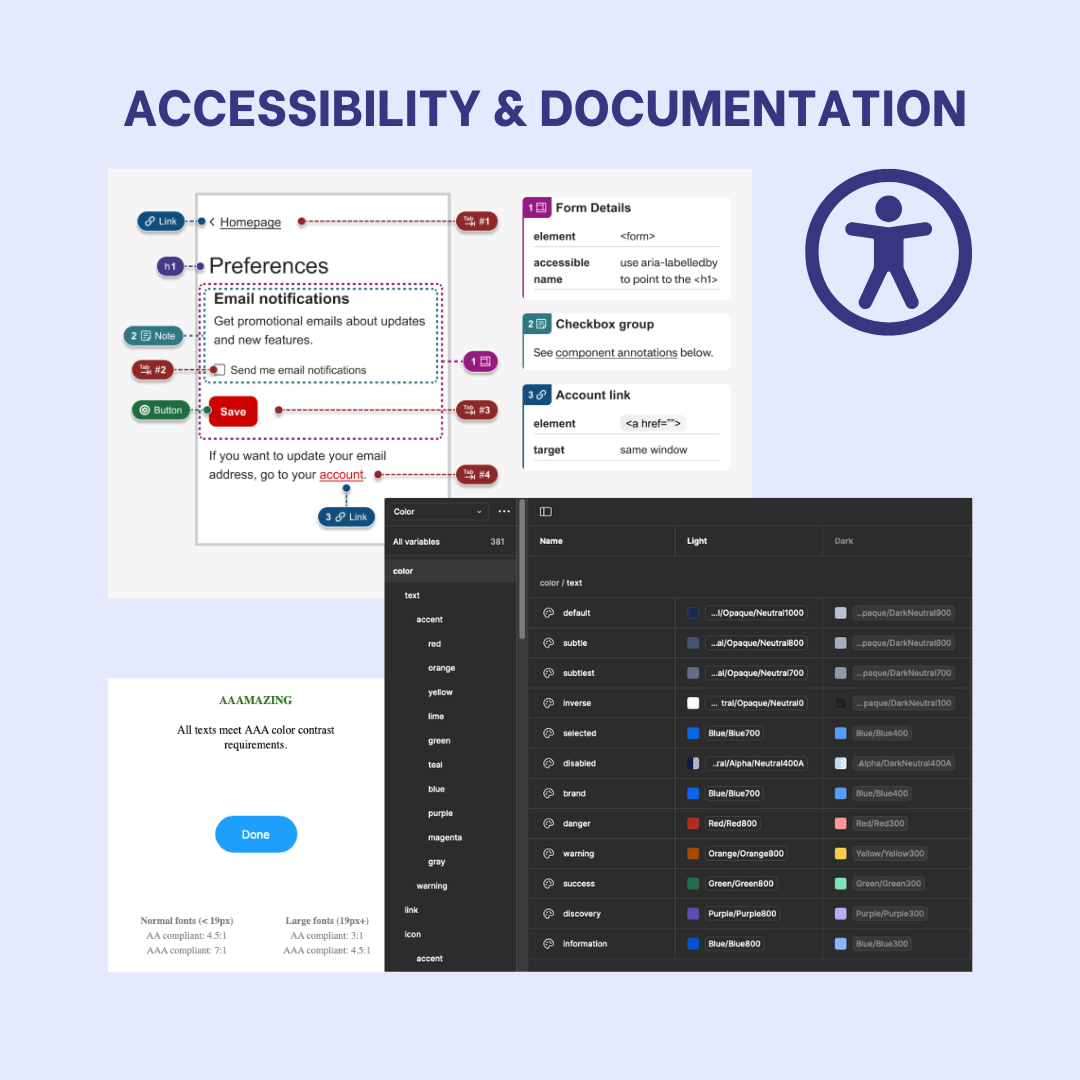
Implemented WCAG standards and used design tokens to ensure consistent & accessible color, spacing, and typography across products—streamlining updates and maintaining compliance at scale.
Key Features
Why This Matters

.png)
📈 Business & Creative Impact
The following impact metrics were projected based on initial user feedback, testing, and performance during the design phase:
30% Faster Data Retrieval: Streamlined data access, significantly reducing time spent on data collection.
45% Faster Portfolio Monitoring: Real-time insights improved portfolio tracking efficiency.
40% Reduced Manual Analysis: Automation of risk assessments and portfolio insights lowered manual data manipulation efforts.


Investor Feedback & Project Potential
The project was unfortunately halted due to the company’s acquisition, but investor feedback was overwhelmingly positive.
Many expressed that the dashboard met their needs, asking, "How can I access this?" and "When is this coming out?"
This feedback affirmed the dashboard’s value and strong demand, showcasing its potential impact and effectiveness, even though it wasn't launched.
📌 Final Thoughts
Proactive Design for Data-Driven Decisions: A well-designed dashboard drives faster, smarter financial decisions by providing real-time insights and reducing analysis time.
Collaboration is Essential: Cross-functional teams are crucial to ensure that the design meets both the technical and business needs of stakeholders.
Accessibility & Usability: Prioritizing inclusive design ensures that insights are accessible and usable by all stakeholders, enhancing engagement and satisfaction.
Scalable Solutions: A scalable and flexible design framework allows for continued growth without sacrificing user experience or performance.
